Page History
...
Table of Contents
Why use CardioLog Analytics?
CardioLog Analytics offers comprehensive reports and actionable data for SharePoint and Microsoft 365 applications, leveraging content hierarchy, taxonomy, metadata, and user profile information.
Key features include:
- Custom Reports: Tailor reports to your specific needs.
- Data Integration: Combine data from various data sources.
- Drill-Down Capabilities: Analyze down to specific users, list items, pages, or documents.
- User Journey Reports: Track user engagement and interactions.
- Campaign Tracking: Monitor email campaign effectiveness.
- Detailed Visit Information: Capture geolocation, device, and OS data.
- Unused Content and Inactive Users Identification: Highlight content that is not being utilized and users who are not using the portal.
- Exporting Options: Various formats available for data export such as Excel, PowerPoint and PDF.
- Advanced Filtering: Filter data by date range, content structure and metadata, user profile attributes, and more.
For an in-depth comparison between CardioLog Analytics and SharePoint out-of-the-box analytics, please refer to this article.
Reasons why metrics are different
Different Tracking Methods
- CardioLog Analytics: Uses client-side JavaScript tagging, capturing data only when a page is successfully loaded in a user's browser. This method ensures tracking of actual user interactions, including clicks and mouse movements. This method is more accurate for user interactions as it only tracks human activity.
- SharePoint Analytics: Relies on server-side tracking, collecting data from all requests made to the server, including non-human activities like search indexing and automated processes. Using this method may include automated processes, inflating metrics like page views and unique users.
Different Metric Definitions
- Page Views: CardioLog Analytics records a page view only when a page is fully loaded after a user opens or reloads it, ensuring more accurate results. If a user opens a page and leaves quickly without waiting for it to fully load, it will not count as a page view in CardioLog. In contrast, SharePoint might count multiple views for interactions on the same page. For instance, if a user is viewing a search results page and clicks on the search filters, SharePoint counts each filter click as a separate page view, even though the user remains on the same page. In CardioLog, such interactions are considered a single page view.
- Visits: CardioLog Analytics terminates a visit (browser session) after 30 minutes of user inactivity. In contrast, SharePoint may end a session within just a few minutes of inactivity. Consequently, viewing a page for 30 minutes might be recorded as multiple visits in SharePoint metrics but will count as a single visit in CardioLog.
- Unique Users: In SharePoint, the unique users metric is derived from page views and includes all requests to the server, inflating user counts due to automated processes like search indexing. That is why SharePoint's unique users counts are often higher than the actual number of users. CardioLog Analytics, however, focuses on actual human interactions, providing a more accurate count by excluding automated activities. This, combined with the ability to filter out specific users (like administrators or content editors) in CardioLog Analytics, gives a precise picture of genuine user interactions.
Different Data Filters
- CardioLog Filters: CardioLog Analytics reports utilize filters to include or exclude specific data. For instance, reports can exclude certain users or groups from the analytics data, providing more tailored insights.
- Time Period Selection: CardioLog Analytics allows selecting specific time periods for metrics. SharePoint often shows metrics for the last 7/30/90 days, which may not align with the time range selected in CardioLog. Additionally, CardioLog does not include the current day, which may be included in SharePoint analytics.
- Lifetime Values: Some SharePoint metrics, like Views, use lifetime values. If a page existed before CardioLog tracking was implemented or the selected date range in CardioLog does not cover the entire existence of the page, the metrics will differ.
Different Tracking Scenarios
Please see the below table that describes various scenarios in which an event is recorded and by which product:
Scenario | CardioLog Analytics | SharePoint Analytics |
| Track non-human visits | Not Included | Included |
| Track failed page requests | Not Included | Included |
| Track visits from mobile app | Not Included | Included |
| Track page elements and mouse interactions | Included | Not Included |
| Track search result preview | Included (recorded as a separate search preview event) | Included (recorded as a view) |
| Track custom events (downloads, link clicks, form submissions) | Included | Not Included |
| Track incomplete page requests | Not Included | Included |
| Track pages that do not allow custom JavaScript | Not Included | Included |
| Track administrative pages | Not Included | Included |
| Track a new visit after 30 minutes of inactivity | Included | Not Included |
Conclusion
CardioLog Analytics and SharePoint Analytics provide different insights due to their distinct tracking methods. CardioLog Analytics offers more detailed and accurate user interaction data by focusing on client-side tracking, while SharePoint’s server-side tracking may include non-human activities, affecting the metrics. Understanding these differences can help users choose the right tool for their specific needs.
We recommend our customers perform their own tests to confirm data accuracy in CardioLog Analytics reports. You can follow these steps:
- Test Page Setup: Create a test page with access limited to a controlled group of users.
- User Visits: Have each user open their browser, open the network tab (by pressing F12), and visit the test page several times over several days according to a predefined test plan.
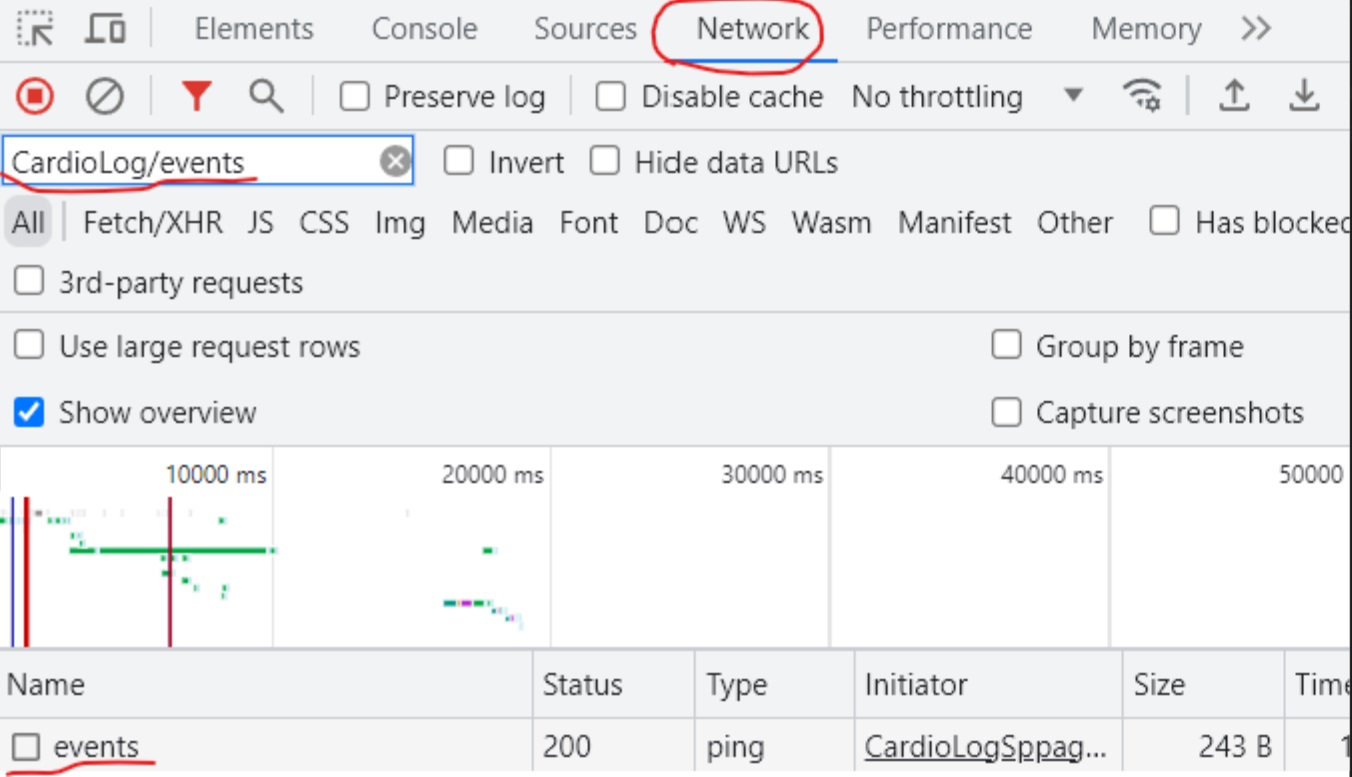
- Confirm Data Collection: After each visit, ensure an event is recorded once the page has fully loaded. Filter the network tab by "CardioLog/events" and look for a successful "events" request (see screenshot below for reference).
- Confirm Data Processing in Reports: Open the CardioLog Analytics Power BI Usage Overview report and verify that the results for the test page match your test plan. Note that the data in reports is refreshed once a day, so be sure to check the report after the next scheduled Power BI refresh.