Occasionally, changes in your system may affect CardioLog behavior. If you notice errors in data collection, it may be due to a failure in the tracking agent. The tracking agent may fail due to various reasons, including network issues, database connection problems, and insufficient permissions. Issues can occur at each step of the data collection process, which we've broken down into these points:
- Downloading the Tracking Code - The JavaScript tracking code is added to a SharePoint common page component and is downloaded to the client browser with each page request.
- Personalizing Content (Optional) - Information about the visitor segments is downloaded to the client browser with each page request. The JavaScript code hides the content of the page, adds or modifies page elements and finally re-displays the page according to visitor segments.
- Tracking Usage Data - Data about user actions within website pages are sent to the CardioLogAgent web application via asynchronous JavaScript calls using AJAX.
- Storing Usage Data - The CardioLogAgent web application passes on the usage information via HTTP/S web requests, to the EventCollector web application, which writes the data into the CardioLog database.
For assistance in troubleshooting tracking agent errors, please open a new support ticket.
Contents
 How to Test the Tracking Agent
 Test Usage Data Collection
Usage data collection can be monitored by the CardioLog Diagnostics Service, which checks the event count for all monitored websites (08:30 AM daily by default), and sends error alerts via email when the event count is under the threshold.
- Configure e-mail alert settings (SMTP server, e-mail recipients) and define a threshold for each monitored website in order to better isolate usage tracking issues.
- You can view the current status of the tracking agents by going to Administration in the navigation pane, and then clicking System Diagnostics. You'll be presented with the Diagnostics Dashboard where you can see the status of all activities.
In order to test event collection:
- Delete the temporary files on your browser and browse to at least three (3) pages on your SharePoint website.
- While on the SharePoint website page, click Ctrl+F12 (or Alt+F12). The tracking agent console should pop-up, displaying the ID number for the most recent monitored action (event). To close the console, press Ctrl+F12 (or Alt+F12).

The tracking agent pop-up
To show/hide the Ctrl+F12 popup open the [Installation Folder]\CardioLogAgent\js\AgentEmbed.js file and edit the following key (values: "true" to display the console, "false" to hide the console):
element.EnableConsole = false; // hide the agent console
[Installation Folder] - by default, the CardioLogAgent folder is located in the CardioLog Installation folder. If the CardioLog Analytics SharePoint feature is installed, the CardioLogAgent folder should be located on all SharePoint WFEs under the SharePoint website "_layouts" folder.
For security reasons, a new Agent Console can replace the Ctrl+F12 popup in versions 2.0.6.0 and up. The console will be visible only to users with a link to it.
In order to add the Agent Console to your browser, click the following link and follow the instructions:
http://[CardioLog server name:port]/CardioLog/Configuration/AgentConsoleBookmarklet.aspx
[CardioLog server name:port] - edit the CardioLog server name and port to match your system
To test event collection when using the Agent Console -
- Delete the temporary files on your browser and browse to at least three (3) pages on your SharePoint website.
- While on the SharePoint website page, click the "Agent Console" bookmark and wait for several seconds. Verify that you see the tracking agent console.
- Click the "CardioLog" tab. The last line should read: "events: event sent. status: 0"
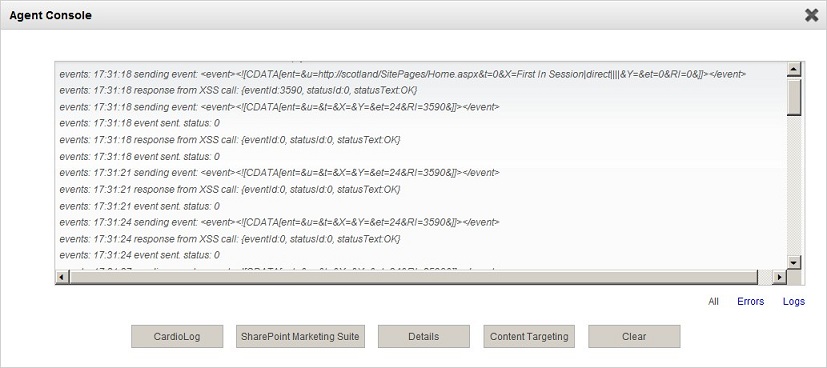
The Tracking Agent Console CardioLog Tab
 Test Content Personalization
To test content personalization, use the Agent Console:
- Delete the temporary files on your browser and browse 3 pages on your SharePoint website.
- While on the SharePoint website page, click the "Agent Console" bookmark and wait for several seconds. Verify that you see the tracking agent console.
- Click the "SharePoint Marketing Suite" tab. Verify that you see the visitor segments information.

The Tracking Agent Console SharePoint Marketing Suite Tab
 Possible Faults
The tracking agent can fail due to various reasons, including network issues, database connection problems, and insufficient permissions. Issues can occur at each step of the data collection process.
For advanced troubleshooting, first determine if the tracking agent files have been successfully downloaded to the client browser. This can be done by using web debugging tools that log all HTTP(S) traffic. We recommend a program like Fiddler. If the tracking agent files have been successfully downloaded, check for server errors.
 Troubleshooting Usage Data Collection Issues
In order to troubleshoot issues with the tracking agent test event collection and follow the instructions relevant to you below:
The 'Last Event #' in the tracking agent pop-up is 'None' or 'N/A', or an error message is displayed in the Agent Console CardioLog tab
- Verify that Anonymous Authentication is enabled for the EventCollector web application in IIS Manager.
- Verify that the EventCollector web application can be accessed from the SharePoint front-ends (WFEs), and that it is not blocked by a firewall or proxy. This is done by browsing to http://[CardioLog server name:port]/EventCollector/monitor.aspx (Input your CardioLog server name and port). The expected result is an XML response. View the ports used by CardioLog Analytics.
If you have deployed the CardioLog Analytics SharePoint feature in order to track usage data, and the EventCollector web application cannot be accessed from the SharePoint front-ends (WFEs) due to security reasons, you can configure the CardioLogAgent web application to redirect to the CardioLog server by modifying the following key in the [SharePoint TEMPLATE folder]\CardioLogAgent\Web.config on all WFEs: <add key="CardioLogAgentRoot" value="http://[CardioLog server name:port]" />
Note: This requires access from the client browser to the CardioLog application server. - Verify that the CardioLog database is working, that the CardioLog application pool user account can connect to it, and the application pool user account is assigned a db_owner role.
- Check for server errors in storing usage data.
The tracking agent pop-up does not show up at all, or the Agent Console shows up without any content
Delete the temporary files on your browser and test event collection again. If it was not helpful, do the following:
- Stop and Start the CardioLogApplicationPool using IIS Manager.
- If you have added the tracking code automatically using the Configuration Wizard, verify you have repeated this step for all of your SharePoint front-ends (WFEs) in your farm.
- If you have deployed the CardioLog Analytics SharePoint feature, verify it has been activated.
- If you have added the tracking code yourself, verify that you have removed the opening and closing <script> tags.
- Verify that the CardioLogAgent web application can be accessed from your workstation, and it is not blocked by a firewall or proxy. This is done by browsing to http://[CardioLog server name:port]/EventCollector/monitor.aspx (Input your CardioLog server name and port). View the ports used by CardioLog Analytics.
- Check for server errors in tracking usage data.
You receive a login box
- If you are using Internet Explorer, click Tools > Internet Options > Security > Custom Level > User Authentication > Logon > select 'Choose Automatic logon with user name and password'.
- Verify that the CardioLogAgent directory files have at least 'Read' permissions assigned to all users, including the application pool account.
- If you still get a login box, install the CardioLog Analytics SharePoint feature.
You get a JavaScript error on the page
You receive a browser security message
 Troubleshooting Content Personalization Issues
In order to troubleshoot issues with the tracking agent test content personalization and follow the instructions below according to the outcome:
The Agent Console loads, but without any content
- Stop and Start the CardioLogApplicationPool in IIS.
- If you have added the tracking code automatically using the Configuration Wizard, verify you have repeated this step for all of the SharePoint front-ends (WFEs) in your farm.
- If you have deployed the CardioLog Analytics SharePoint feature, verify it has been activated.
- If you have added the tracking code yourself, verify that you have removed the opening and closing <script> tags.
- Verify that the CardioLogAgent web application can be accessed from your workstation, and it is not blocked by a firewall or proxy. This is done by browsing to http://[CardioLog server name:port]/EventCollector/monitor.aspx (Input your CardioLog server name and port). View the ports used by CardioLog Analytics.
- Check for server errors in personalizing content.
An error message is displayed in the Agent Console SharePoint Marketing Suite tab
- Verify that the EventCollector web application can be accessed from your SharePoint front-ends (WFEs), and that it is not blocked by a firewall or proxy, by browsing to http://[CardioLog server name:port]/EventCollector/caCached.aspx (Input your CardioLog server name and port). The expected result is an XML response. View the ports used by CardioLog Analytics.
- Verify that the CardioLog database is up and running, and the CardioLog application pool user account is assigned a db_owner role, and can connect to the database.
- Check for server errors in personalizing content.
You see a blank page for about 5 seconds and then the page loads with no content modifications
The default timeout for loading the visitor segments information in order to personalize the page content is 5 seconds. In case of a connection error, do the following:
- Configure the default timeout for content personalization in the JavaScript tracking code.
- Verify the CardioLogAgent web application can be accessed from your workstation, and it is not blocked by a firewall or proxy. This is done by browsing to http://[CardioLog server name:port]/CardioLogAgent/ca.aspx (Input your CardioLog server name and port). View the ports used by CardioLog Analytics.
You get a JavaScript error on the page
 How to View Server Error Messages
In order to configure detailed server errors for the tracking agent, edit the "KeywordForShowingErrors" key in the following files: [CardioLog Installation Folder]\CardioLogAgent\Web.config and [CardioLog Installation Folder]\EventCollector\Web.config:
<add key="KeywordForShowingErrors" value="[keyword]"/>
[keyword] - keyword for debugging.
To view the server error, browse to the relevant web application page (as detailed below) and add the "kfse" URL parameter. The "kfse" URL parameter value must correspond to the "KeywordForShowingErrors" keyword)
Each customer must set his own unique value for "kfse".
When using a valid "kfse" URL parameter, page caching and timeouts are ignored and you can view the server error. In order to avoid caching, modify the "kfse" parameter value every time so it contains the original value, for example, if "kfse" is "test", then use "test1", "test2", "testabc", etc. each time you browse to the page.
In order to turn on message logging to trace the tracking agent, add the "Message" switch to the "logType" key to the [CardioLog Installation Folder]\EventCollector\web.config file -
<add key="logType" value="Message,Warning,Error" />
 View Server Errors in Tracking Usage Data
To view the server error, browse the following page and add the "kfse" URL parameter. The "kfse" URL parameter value must correspond to the "KeywordForShowingErrors" keyword:
- http://[CardioLog server name:port]/CardioLogAgent/tunnel.aspx?kfse=[keyword]
Example error message: "Error caught in tunnel: Request timed out"
Solution: Verify that the EventCollector web application can be accessed from the SharePoint front-ends, and that it has not been blocked by a firewall or proxy. This is done by browsing to http://[CardioLog server name:port]/EventCollector/monitor.aspx (Input your CardioLog server name and port). The expected result is an XML response. View the ports used by CardioLog Analytics.
 View Server Errors in Storing Usage Data
To view the server error, browse to the following page and add the "kfse" URL parameter. The "kfse" URL parameter value must correspond to the "KeywordForShowingErrors" keyword:
- http://[CardioLog server name:port]/EventCollector/monitor.aspx?kfse=[keyword]
To view a detailed log of the data collection process, open the [CardioLog Installation Folder]/CardioLogScheduleServices\Logs\EventCollector.log file.
Example error messages: "Error registering event", "Unrecognized event type"
Solution: Verify that the CardioLog database is up and running, the CardioLog application pool user account is assigned a db_owner role, and can connect to the database.
 View Server Errors in Personalizing Content
To view the server error, browse to the following pages and add the "kfse" URL parameter. The "kfse" URL parameter value must correspond to the "KeywordForShowingErrors" keyword.
Note: these files are cached by default, in order to avoid caching and display the error message, modify the "kfse" parameter value every time so it contains the original value. For example, if "kfse" is "test", then use "test1", "test2", "testabc", etc. each time you browse to the page.
- http://[CardioLog server name:port]/CardioLogAgent/ca.aspx?kfse=[keyword]1
- http://[CardioLog server name:port]/EventCollector/caCached.aspx?kfse=[keyword]1
Example error message:
"dataError = 'Contents: A network-related or instance-specific error occurred while establishing a connection to SQL Server. The server was not found or was not accessible. Verify that the instance name is correct and that SQL Server is configured to allow remote connections. (provider: Named Pipes Provider, error: 40 - Could not open a connection to SQL Server)"
Solution: Verify that the CardioLog database is up and running, the CardioLog application pool user account is assigned a db_owner role, and can connect to the database.